deldir包绘制Voronoi图
#install.packages("deldir")
library(deldir)# data
set.seed(1)
x<- runif(60)
y<- runif(60)# Calculate Voronoi Tesselation and tiles
tesselation<- deldir(x, y)
tiles<- tile.list(tesselation)

plot(tiles, pch=19,
     border="black",#边界颜色
     showpoints= TRUE,#是否显示点
     fillcol= hcl.colors(60,"Sunset"))#填充颜色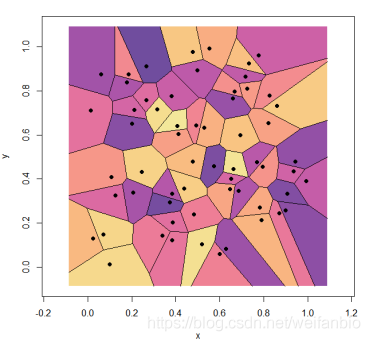
#改变图形的形状#install.packages("polyclip")
library(polyclip)# Circle环状
s<- seq(0,2 * pi, length.out=3000)
circle<- list(x=0.5 *(1 + cos(s)),
               y=0.5 *(1 + sin(s)))
plot(tiles, pch=19,
     col.pts="white",
     border="black",
     fillcol= hcl.colors(60,"Sunset""),
     clipp= circle)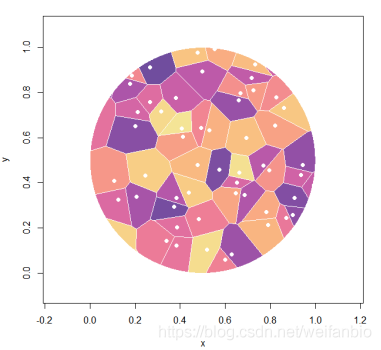
ggplot2绘制Voronoi图
library(ggvoronoi)
library(ggplot2)

set.seed(1)
x<- sample(1:600, size=100)
y<- sample(1:600, size=100)
dist<- sqrt((x-200)^2+(y-200)^2)

df<- data.frame(x, y, dist= dist)

ggplot(df, aes(x, y)) +
  stat_voronoi(geom="path",
               color=6,
               lwd=0.7,
               linetype=1)
  geom_point()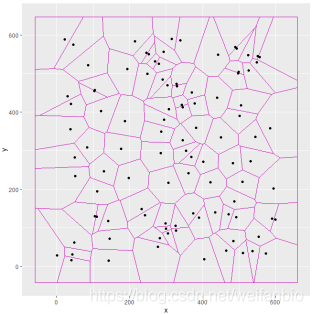
#添加热图
ggplot(df, aes(x, y, fill= dist)) +
  geom_voronoi() +
  geom_point() +
  scale_fill_gradient(low="#20B2AA",
                      high="#9370DB")#颜色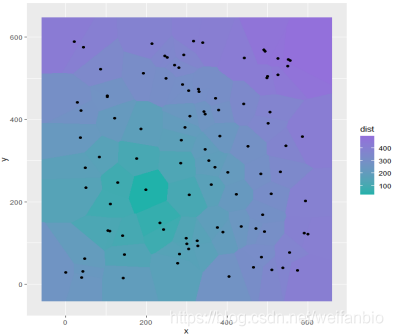
#添加边界线
ggplot(df, aes(x, y, fill= dist)) +
  geom_voronoi() +
  stat_voronoi(geom="path") +
  geom_point()+
  scale_fill_gradient(low="#20B2AA",
                      high="#9370DB")#theme(legend.position = "none") # 去掉右侧图例标签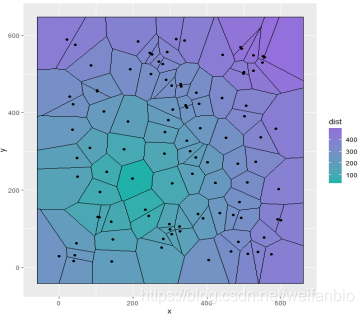
“作图帮”微信公众号同步更新~