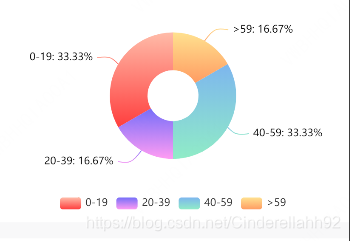
先看下效果
使用步骤如下:
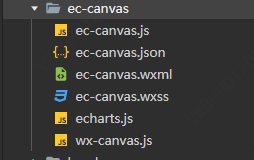
一、导入echart包,结构如下:
二、在json中引用
{
  "usingComponents": {
    "ec-canvas": "../../../Components/ec-canvas/ec-canvas"
  }
}
三、在html中使用
<view class="line">
	<ec-canvas canvas-id="mychart-multi" ec="{{ ecage }}"></ec-canvas>
</view>
四、在js中使用
//引入echarts
import * as echarts from '../../../Components/ec-canvas/echarts';

var lineops = [{
  value: 40,
  name: '0-19'
},
{
  value: 20,
  name: '20-39'
},
{
  value: 40,
  name: '40-59'
},
{
  value: 20,
  name: '>59'
}
]
Page({
    data: {
    ecage: {
      onInit: function (canvas, width, height, dpr) {
        const AgeChart = echarts.init(canvas, null, {
          width: width,
          height: height,
          devicePixelRatio: dpr // new
        });
        canvas.setChart(AgeChart);
        AgeChart.setOption(getBarOption());
        return AgeChart;
      }
    }
//可以在方法请求中改变lineops数据
})
//初始化
function getBarOption() {
  console.log(lineops)
  return {
    legend: {
      bottom: 10,
      left: 'center'
    },
    series: [{
      type: 'pie',
      radius: ['30', '60%'],
      clockwise: false,
      center: ['50%', '40%'],
      labelLine: {
        smooth: true
      },
      label: {
        formatter: '{b}: {d}%'
      },
      itemStyle: {
        color: function (params) {
          let colorList = [
            ['#FFBBA8', '#FF3E3E'],
            ['#766EF9', '#FF9CF3'],
            ['#7DB6EE', '#90ECC7'],
            ['#FFE18F', '#FF9C62'],
          ]
          let index = params.dataIndex
          if (params.dataIndex >= colorList.length) {
            index = params.dataIndex - colorList.length
          }
          return new echarts.graphic.LinearGradient(0, 0, 0, 1,
            [{
              offset: 0,
              color: colorList[index][0]
            },
            {
              offset: 1,
              color: colorList[index][1]
            }
            ])
        }
      },
      data: lineops,
      },
    ]

}
}
五、设置样式
.line {
  width: 750rpx;
  height: 450rpx;
}