文章目录
在使用jupyter notebook时经常会用到matplotlib库,来实现交互式绘图,能够支持数据查看,数据位置确定,图像移动等功能
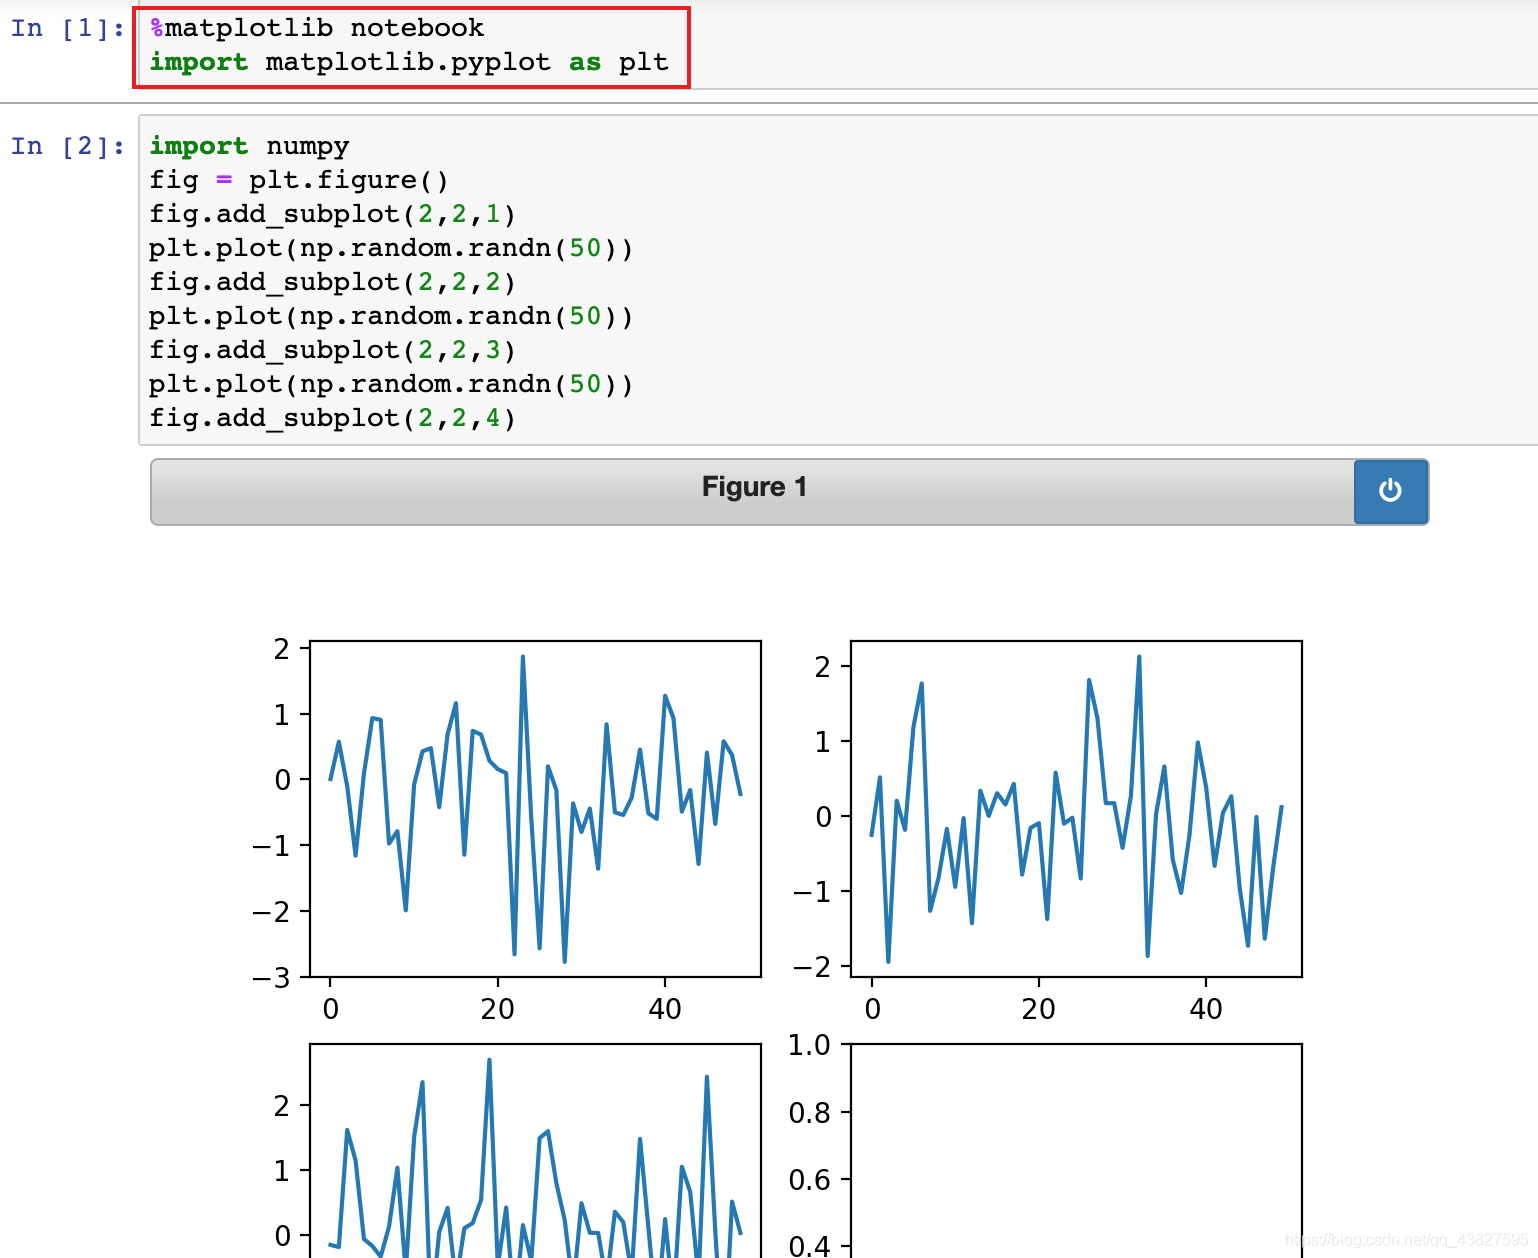
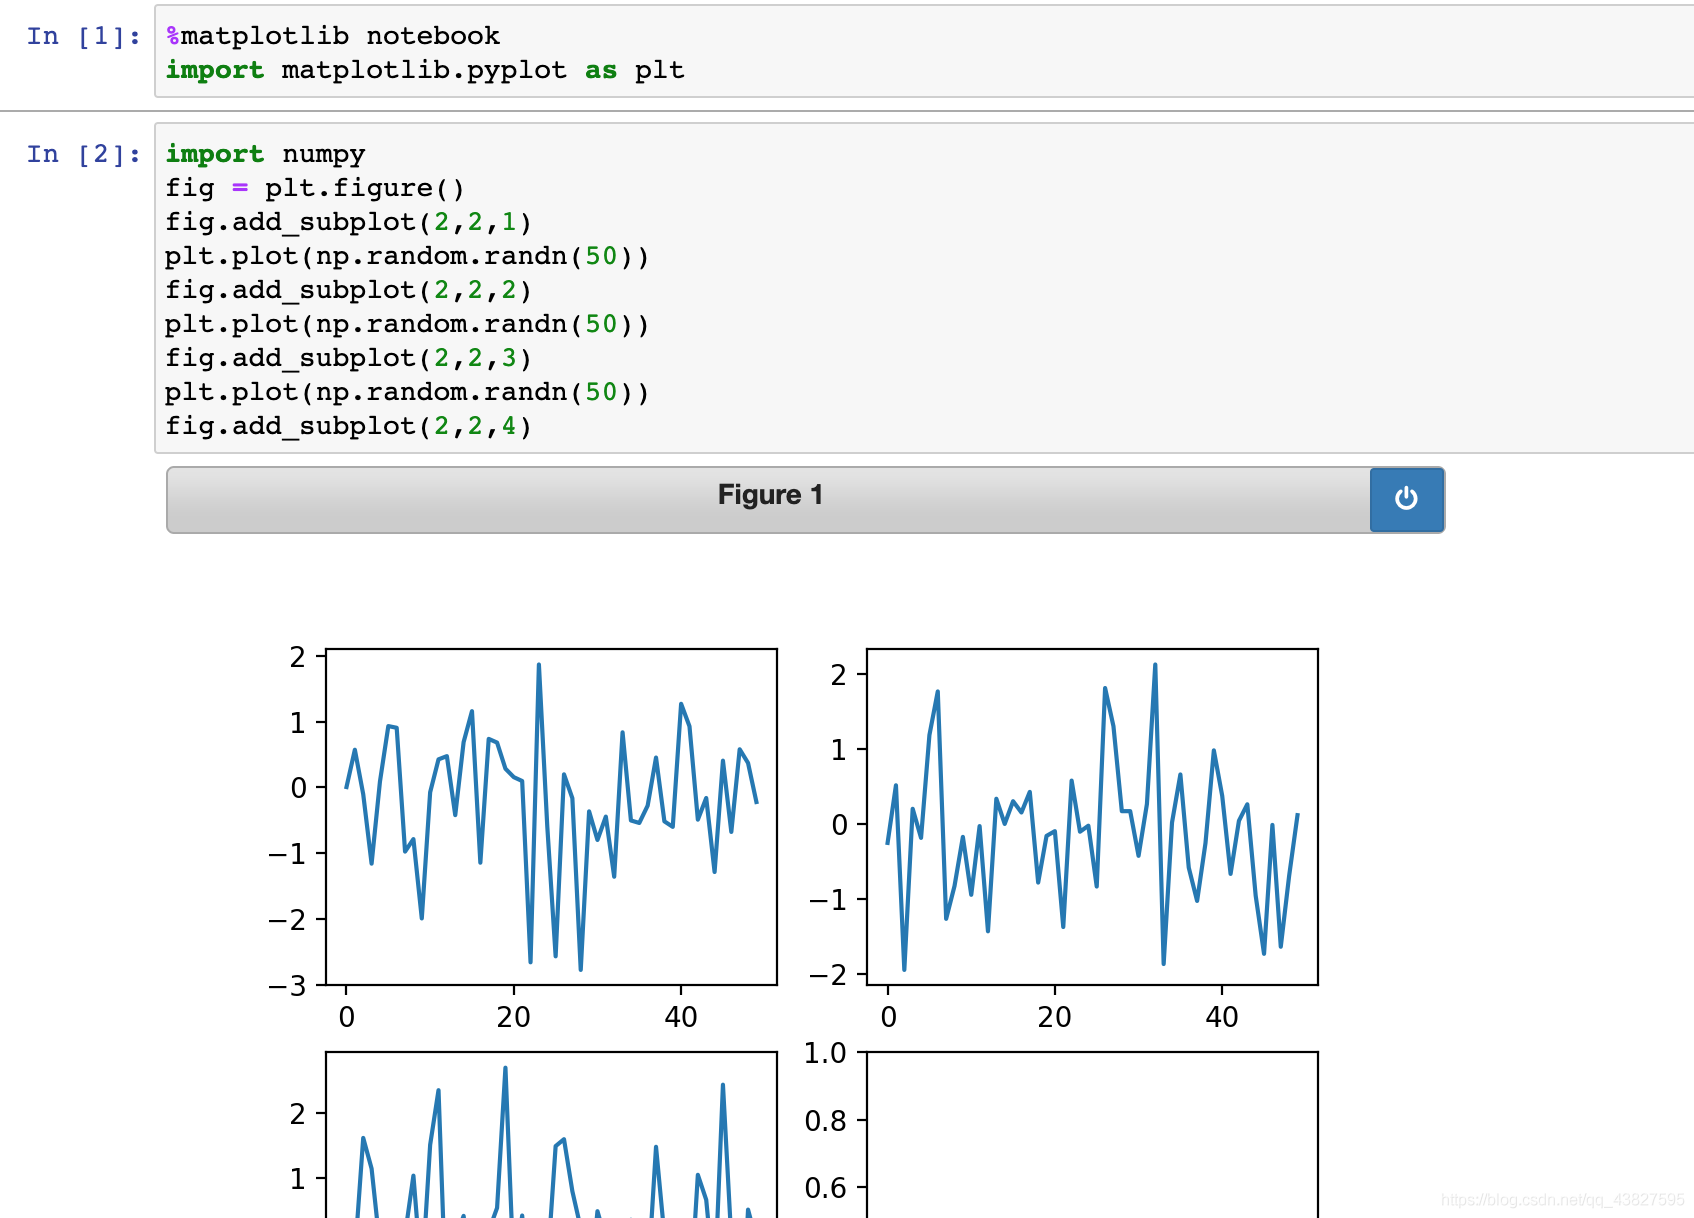
一、%matplotlib notebook(推荐)
在开头加上如下代码可以在jupyter notebook行内形成交互式的图表
%matplotlib notebook
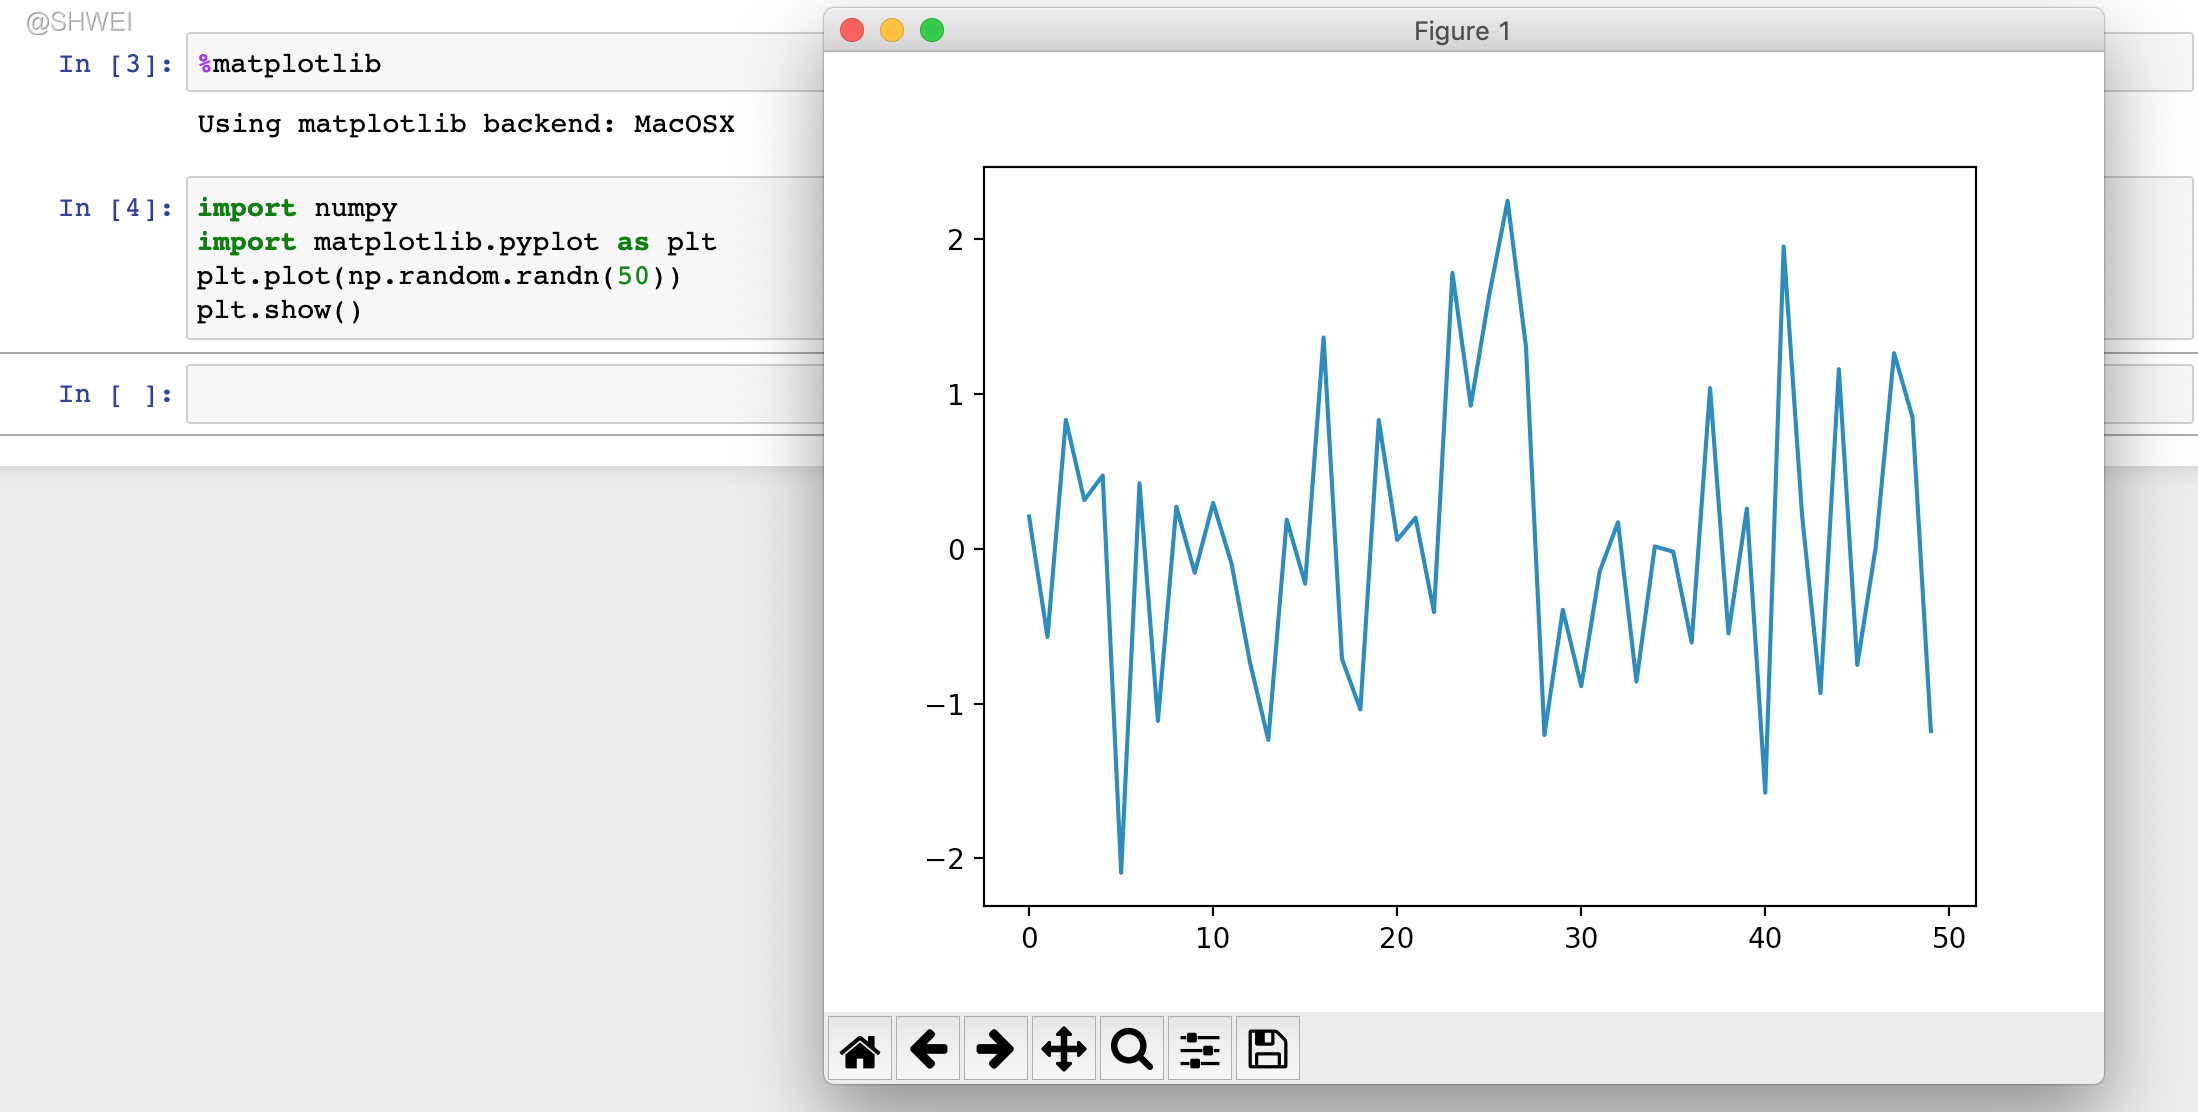
二、%matplotlib
在开头加上如下代码可以在mac内形成交互式的图表,即会弹出图像窗口
%matplotlib
三、%matplotlib inline(适合导出md格式)
开头加上如下代码可以显示图像,但无交互功能
%matplotlib inline
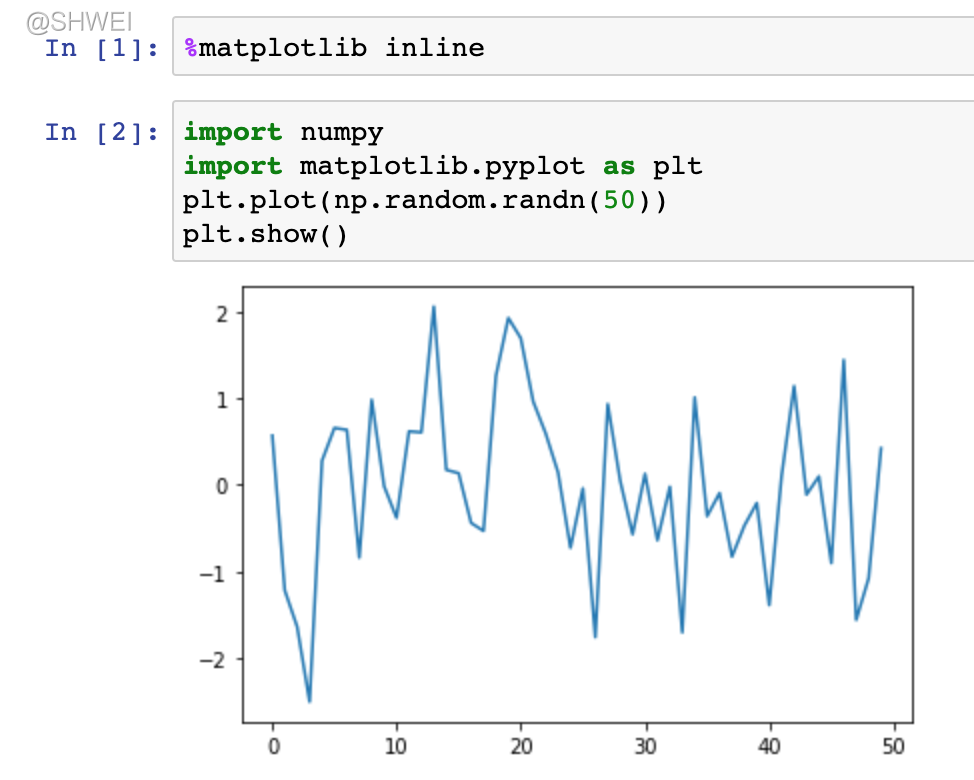
注意:如果要把jupyter notebook导出成markdown格式,那么你要把开头那句话改成%matplotlib inline,这样才会导出生成的图片(会自动放在同一个文件夹中)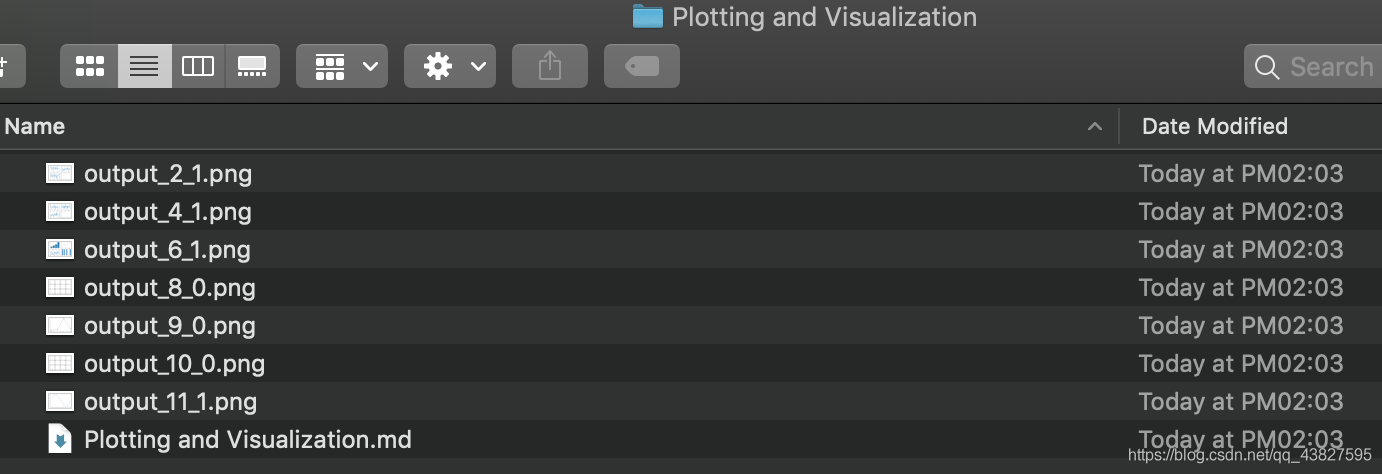
如果开头不加上面所说的代码,运行后也会形成一张干巴巴的图片,无法实现交互式功能
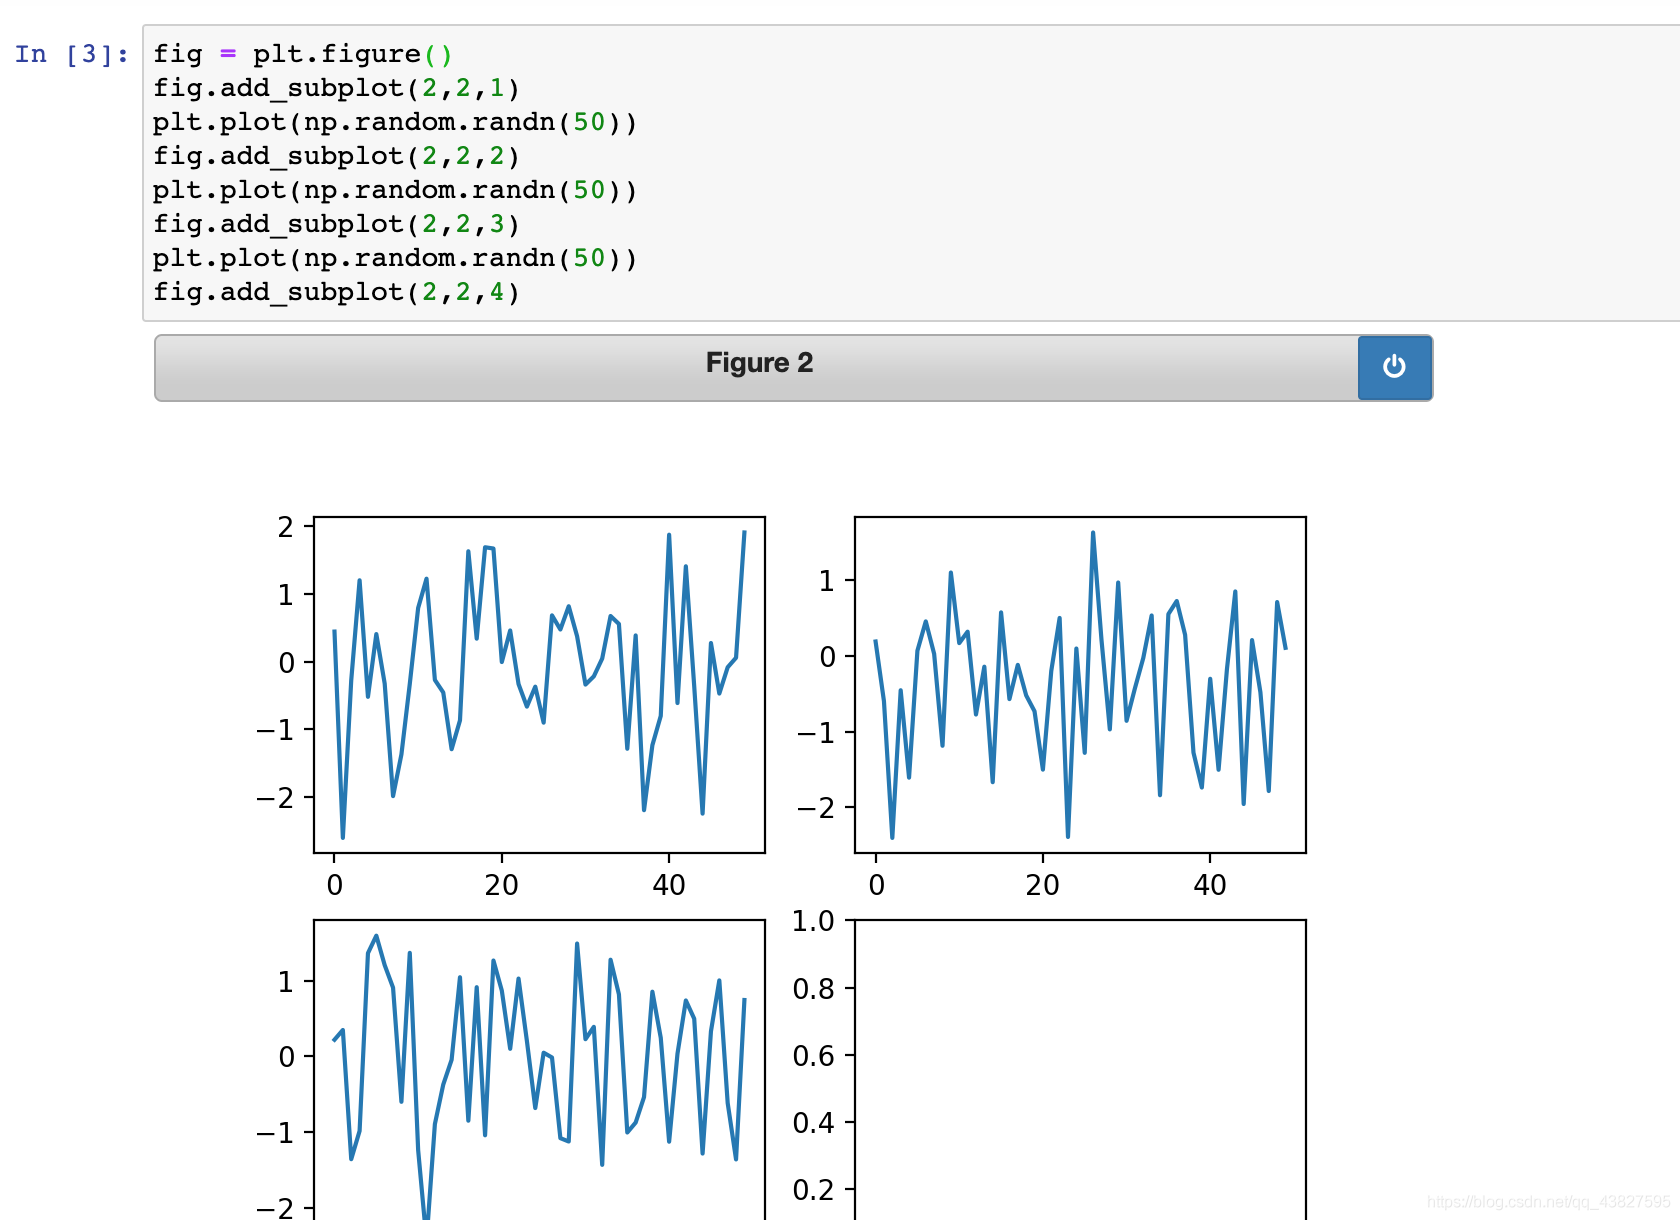
四、在每个单元格运行后,图表被重置
使用jupyter notebook时有个细节需要注意,在每个单元格运行后,图表被重置,因此对于复杂的图标,你必须将所有的绘图命名放在单个的notebook单元格内(%matplotlib notebook和import matplotlib.pyplot as plt只要在最开头加一句就够了)
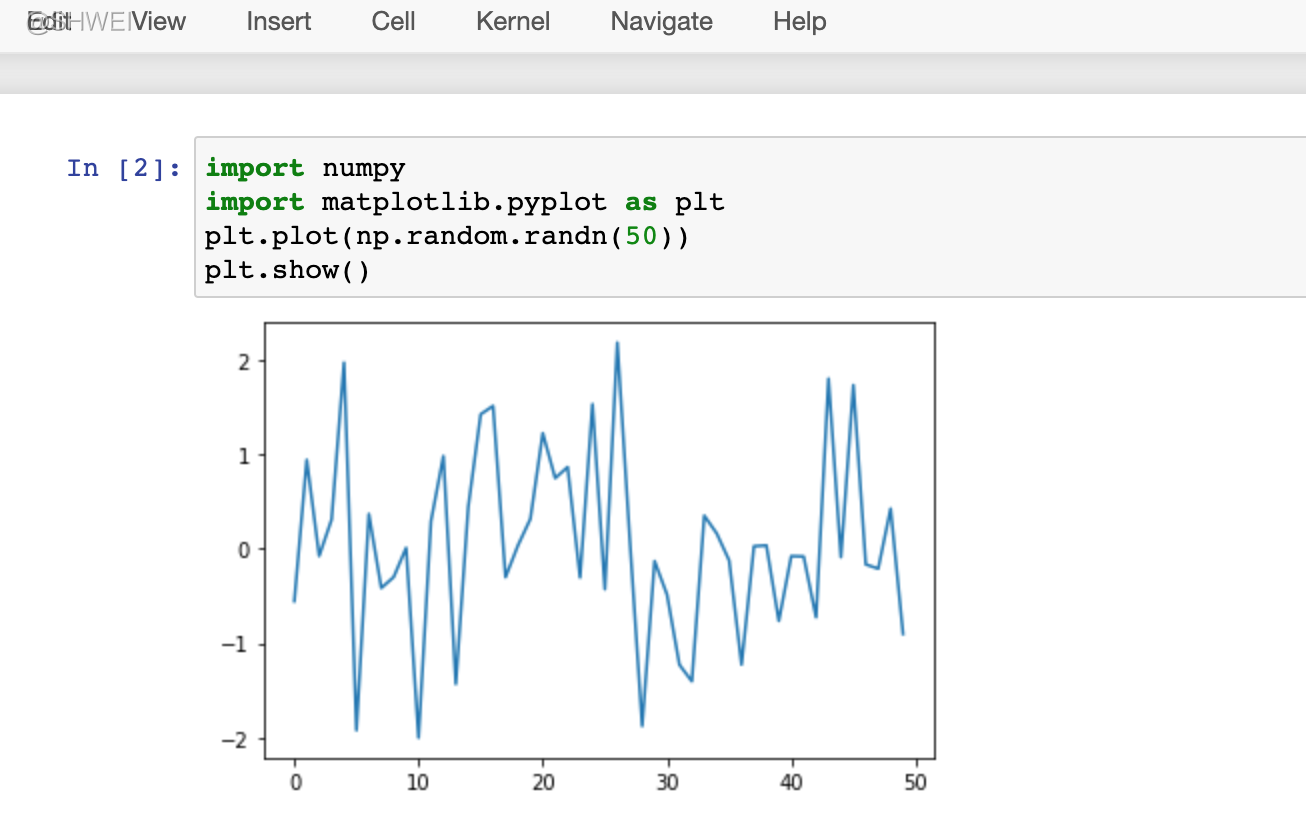
五、在VScode中要用plt.show()
在VScode中使用%matplotlib会报错,正确做法是用plt.show()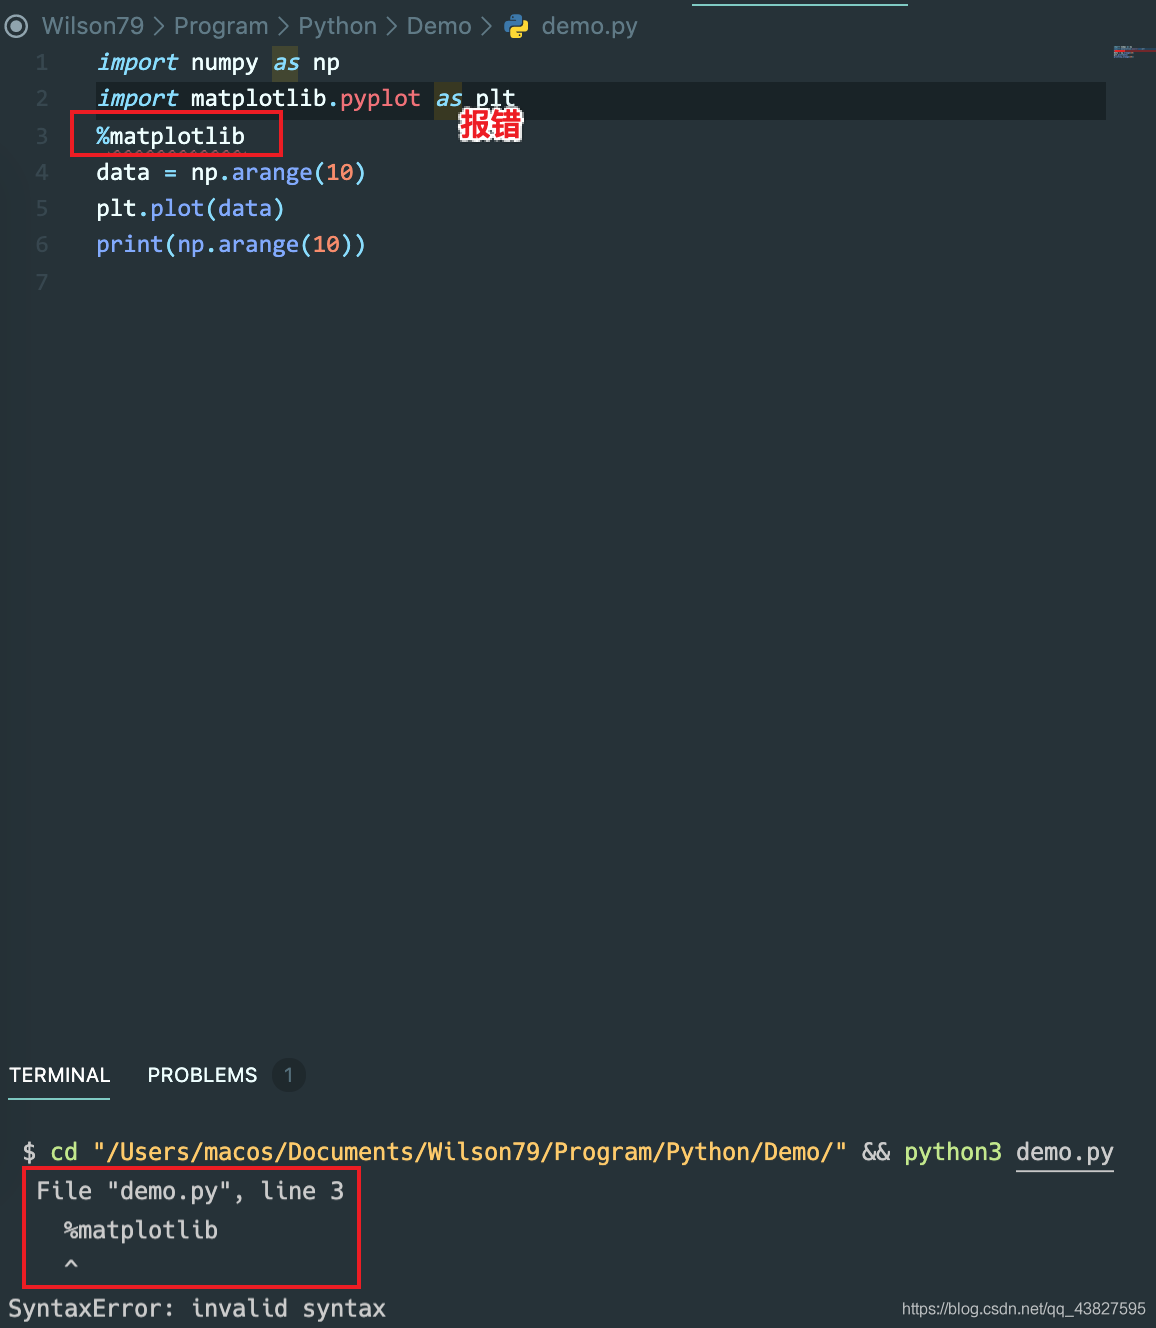
plt.show() 保持图像打开,关闭图像才会继续往下运行代码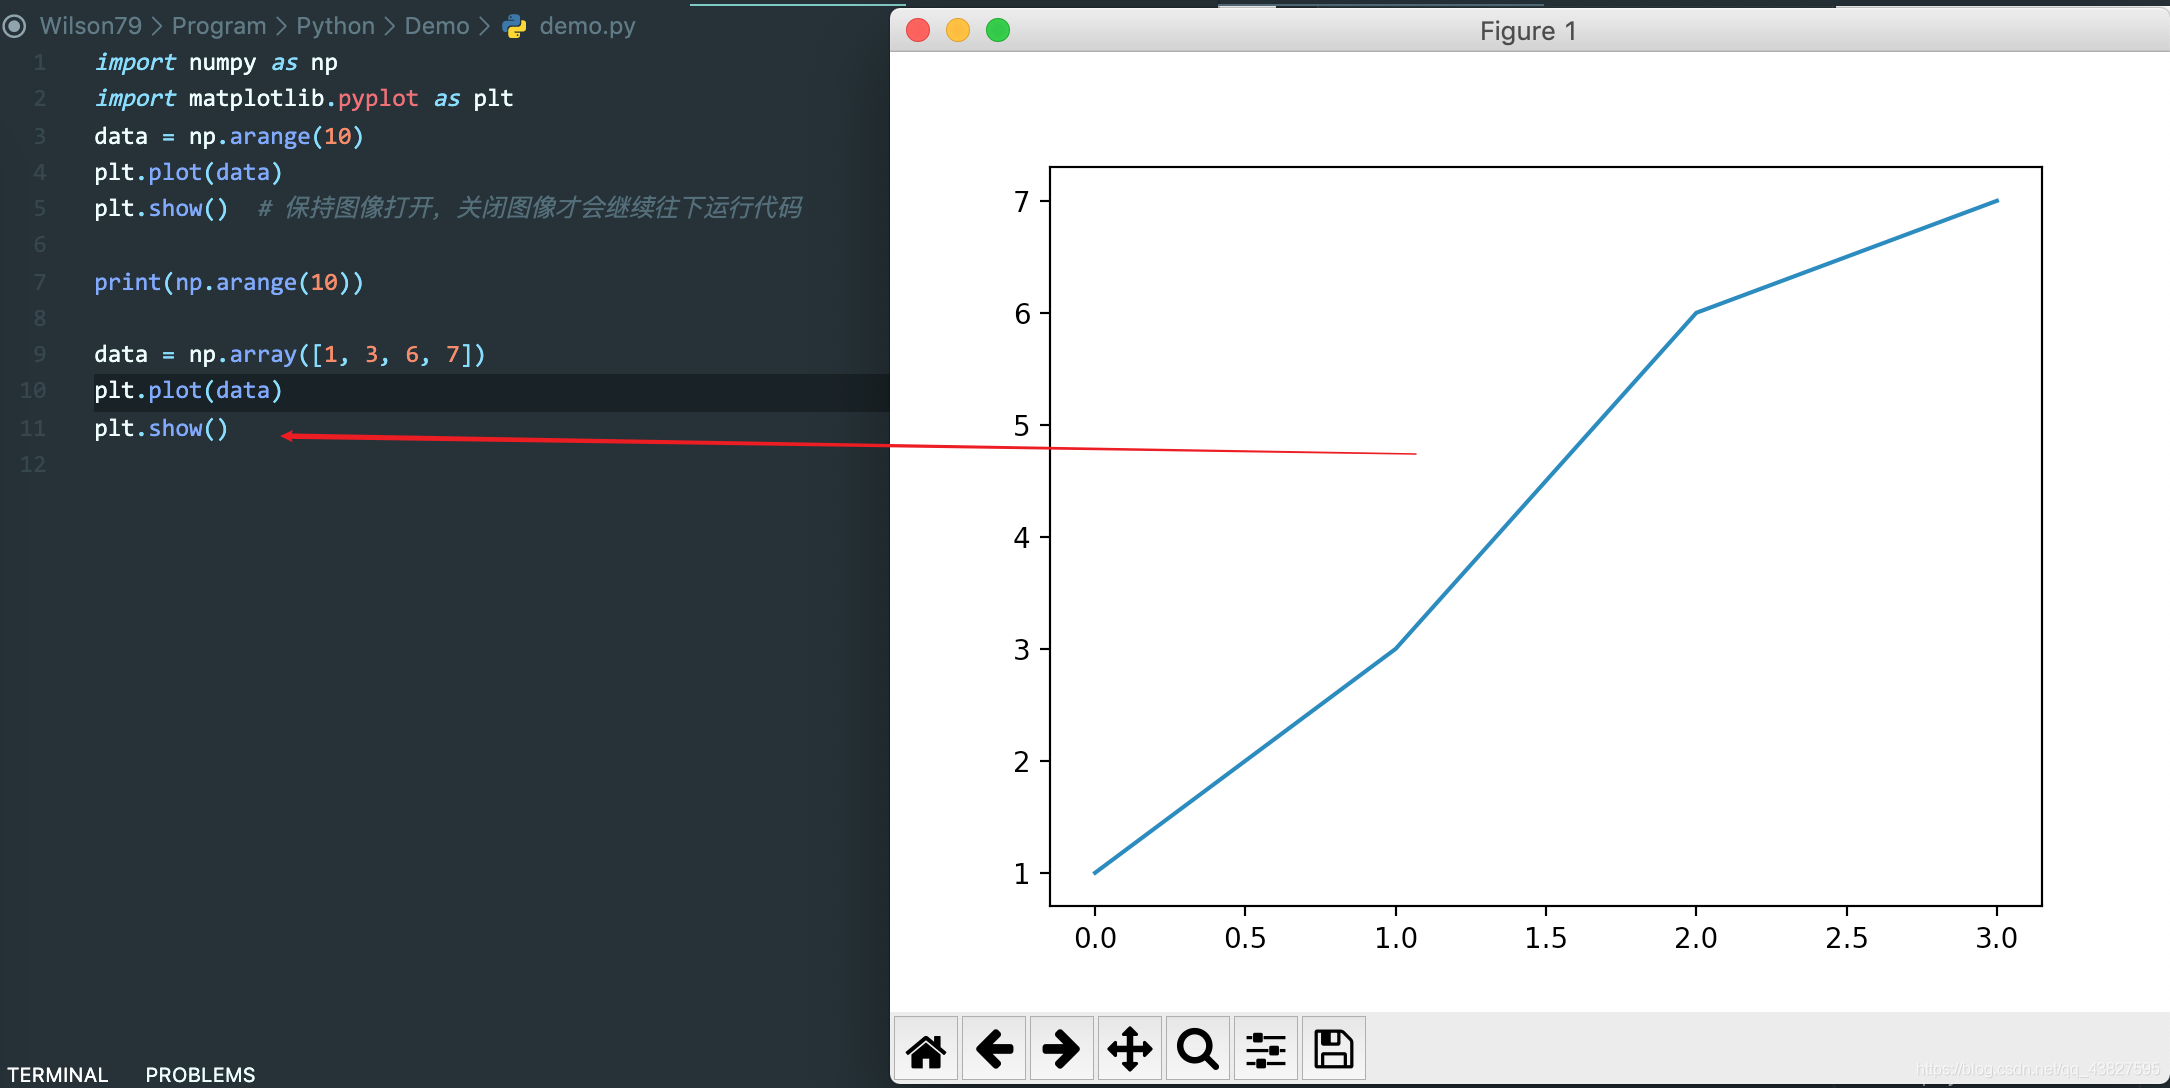
import numpy as np
import matplotlib.pyplot as plt

x = np.arange(0, 2*np.pi, 0.1)
y1 = np.sin(x)
y2 = np.cos(x)

plt.figure(1)
plt.plot(x, y1)
plt.pause(2)  # 在figure(1)上绘制sin曲线,2s后自动关闭窗口

plt.figure(2)
plt.plot(x, y2)
plt.pause(2)  # 在figure(2)上绘制cos曲线,2s后自动关闭窗口

plt.pause(0)  # 重新绘制figure(1)和figure(2),不会自动关闭
print(2)