转载(有增减,后面有举例):http://blog.csdn.net/guduruyu/article/details/60868501
[python] view plain copy
import numpy as np
import matplotlib.pyplot as plt
# Have colormaps separated into categories:
# http://matplotlib.org/examples/color/colormaps_reference.html
cmaps = [('Perceptually Uniform Sequential',
['viridis', 'inferno', 'plasma', 'magma']),
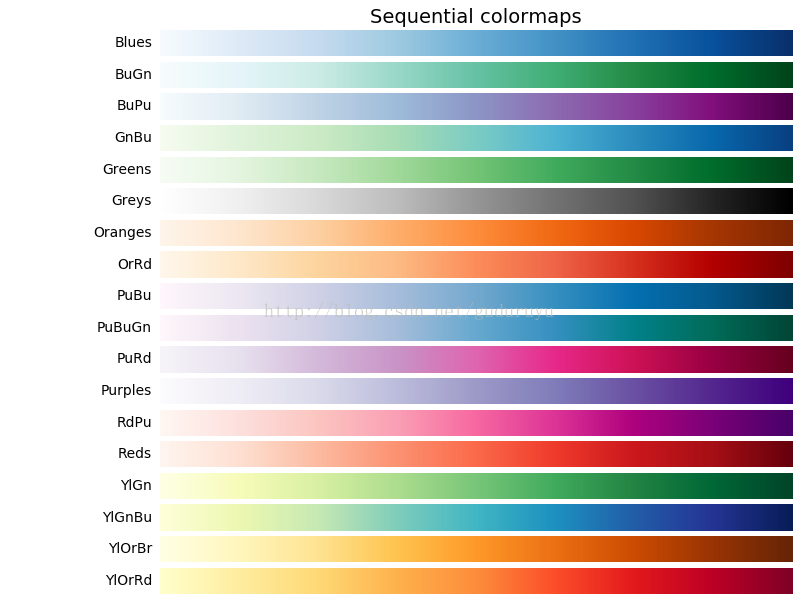
('Sequential', ['Blues', 'BuGn', 'BuPu',
'GnBu', 'Greens', 'Greys', 'Oranges', 'OrRd',
'PuBu', 'PuBuGn', 'PuRd', 'Purples', 'RdPu',
'Reds', 'YlGn', 'YlGnBu', 'YlOrBr', 'YlOrRd']),
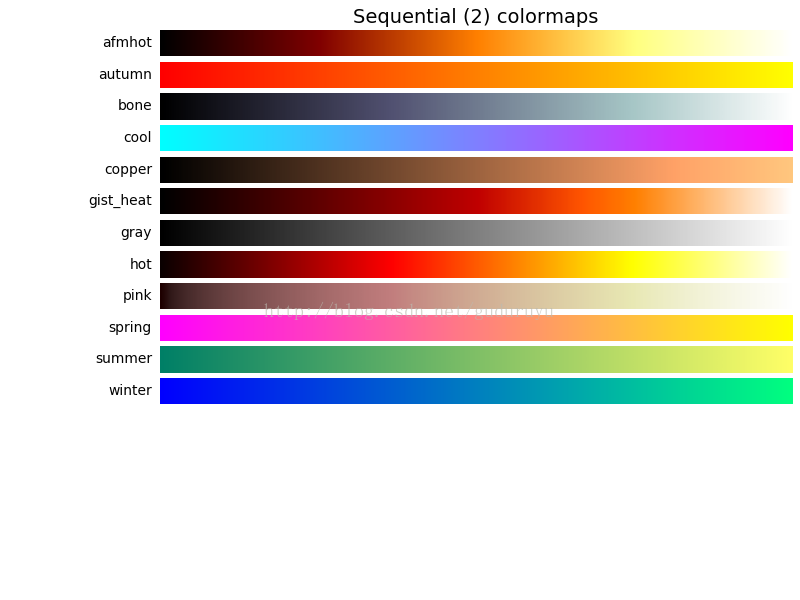
('Sequential (2)', ['afmhot', 'autumn', 'bone', 'cool',
'copper', 'gist_heat', 'gray', 'hot',
'pink', 'spring', 'summer', 'winter']),
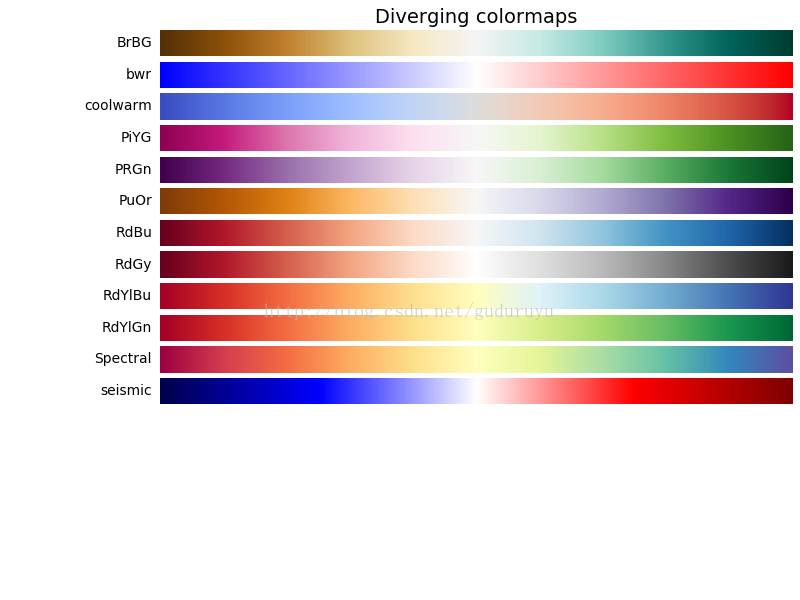
('Diverging', ['BrBG', 'bwr', 'coolwarm', 'PiYG', 'PRGn', 'PuOr',
'RdBu', 'RdGy', 'RdYlBu', 'RdYlGn', 'Spectral',
'seismic']),
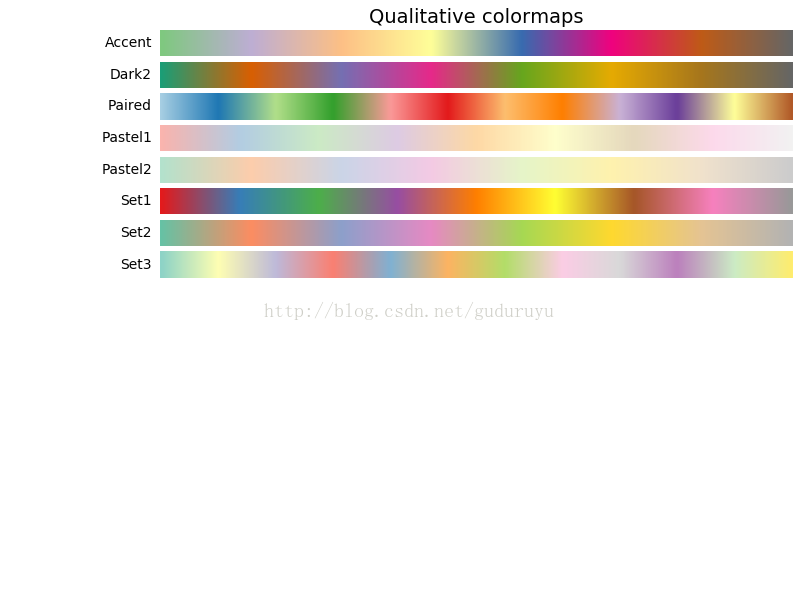
('Qualitative', ['Accent', 'Dark2', 'Paired', 'Pastel1',
'Pastel2', 'Set1', 'Set2', 'Set3']),
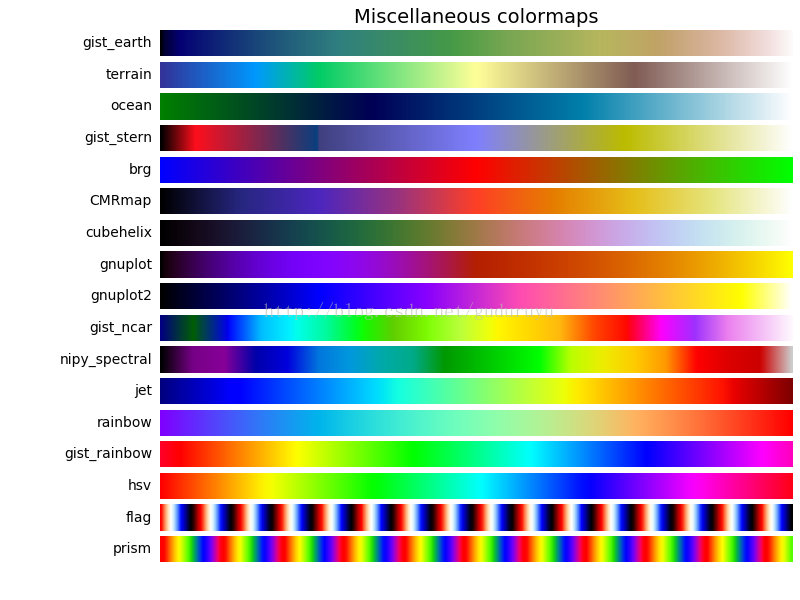
('Miscellaneous', ['gist_earth', 'terrain', 'ocean', 'gist_stern',
'brg', 'CMRmap', 'cubehelix',
'gnuplot', 'gnuplot2', 'gist_ncar',
'nipy_spectral', 'jet', 'rainbow',
'gist_rainbow', 'hsv', 'flag', 'prism'])]
nrows = max(len(cmap_list) for cmap_category, cmap_list in cmaps)
gradient = np.linspace(0, 1, 256)
gradient = np.vstack((gradient, gradient))
def plot_color_gradients(cmap_category, cmap_list):
fig, axes = plt.subplots(nrows=nrows)
fig.subplots_adjust(top=0.95, bottom=0.01, left=0.2, right=0.99)
axes[0].set_title(cmap_category + ' colormaps', fontsize=14)
for ax, name in zip(axes, cmap_list):
ax.imshow(gradient, aspect='auto', cmap=plt.get_cmap(name))
pos = list(ax.get_position().bounds)
x_text = pos[0] - 0.01
y_text = pos[1] + pos[3]/2.
fig.text(x_text, y_text, name, va='center', ha='right', fontsize=10)
# Turn off *all* ticks & spines, not just the ones with colormaps.
for ax in axes:
ax.set_axis_off()
for cmap_category, cmap_list in cmaps:
plot_color_gradients(cmap_category, cmap_list)
plt.show()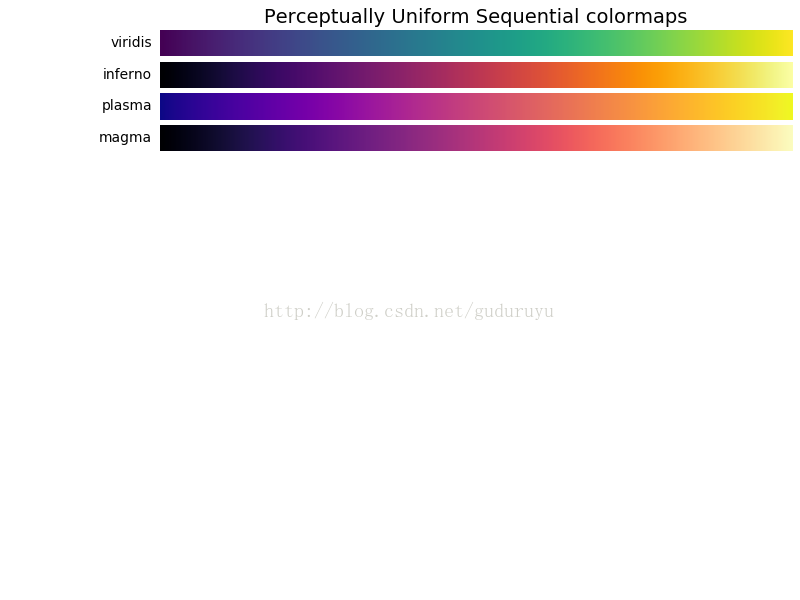
举例1:
横坐标是从1到1000的数,纵坐标是横坐标的平方,要求使用颜色映射为:gist_rainbow(即最后一张图的倒数第四个颜色映射)
import matplotlib.pyplot as plt
x = list(range(1,1001))
y = [i**2 for i in x]#使用列表解析
plt.scatter(x,y,c=y,cmap=plt.cm.gist_rainbow,s=20)#cm即colormap,c=y表示颜色随y变化
plt.xlabel('number',fontsize=10)
plt.ylabel('number square',fontsize=10)
plt.title('figure 1',fontsize =20)
plt.axis([0,1100,0,1100000])
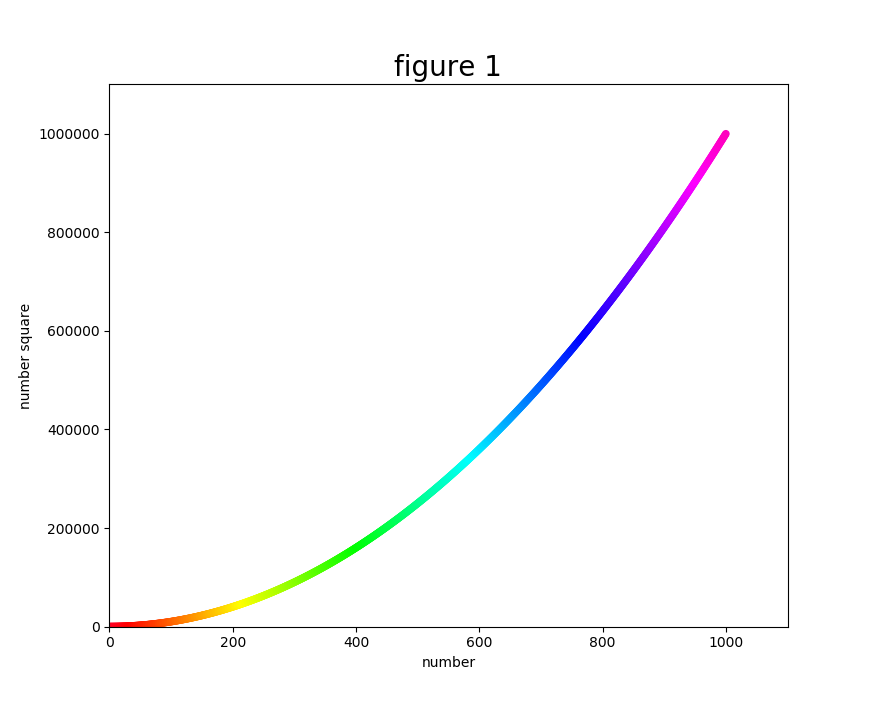
plt.show()代码中cm即colormap,c=y表示颜色随y变化(第一图),也可以使用c=x,使得颜色随x映射(第二图),变化不大
图如下: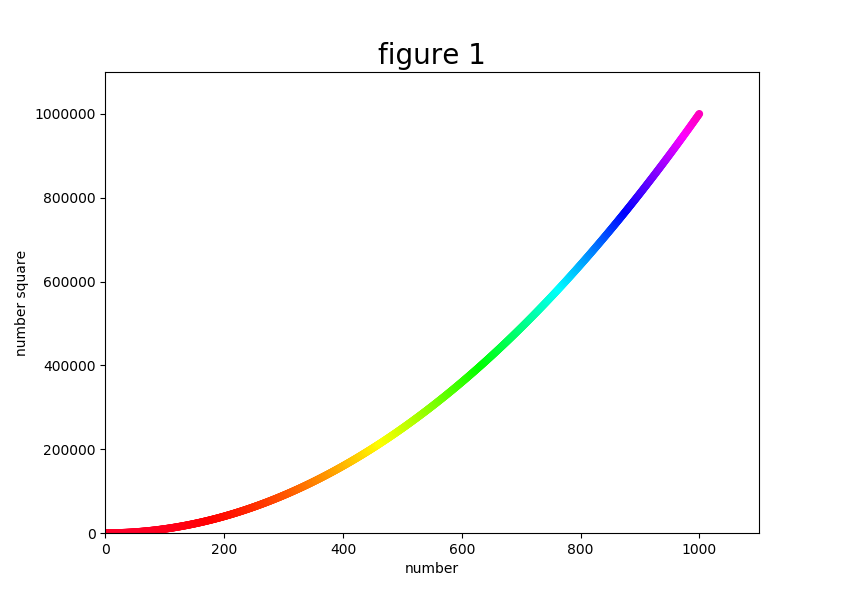
举例2
画一个2维无关高斯分布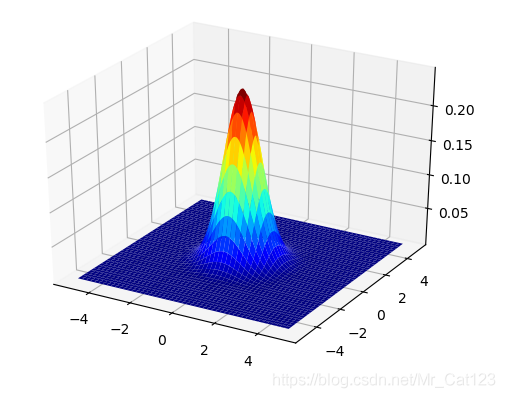
这里实际关于颜色映射的就只有ax.plot_surface(X,Y,F_x_y,cmap='jet')这一行代码,jet是上面给的渐变色中的一个。
import numpyas npimport matplotlib.pyplotas pltimport mpl_toolkits.axisartistas axisartistfrom mpl_toolkits.mplot3dimport Axes3D#画三维图不可少from matplotlibimport cm#cm 是colormap的简写#定义坐标轴函数defsetup_axes(fig, rect):
    ax= axisartist.Subplot(fig, rect)
    fig.add_axes(ax)

    ax.set_ylim(-.2,1.2)#自定义刻度#    ax.set_yticks([-10, 0,9])
    ax.set_xlim(-10,10)
    ax.axis[:].set_visible(False)#第2条线,即y轴,经过x=0的点
    ax.axis["y"]= ax.new_floating_axis(1,0)
    ax.axis["y"].set_axisline_style("-|>", size=1.5)#    第一条线,x轴,经过y=0的点
    ax.axis["x"]= ax.new_floating_axis(0,0)
    ax.axis["x"].set_axisline_style("-|>", size=1.5)return(ax)# 1_dimension gaussian functiondefgaussian(x,mu,sigma):
    f_x=1/(sigma*np.sqrt(2*np.pi))*np.exp(-np.power(x-mu,2.)/(2*np.power(sigma,2.)))return(f_x)# 2_dimension gaussian functiondefgaussian_2(x,y,mu_x,mu_y,sigma_x,sigma_y):
    f_x_y=1/(sigma_x*sigma_y*(np.sqrt(2*np.pi))**2)*np.exp(-np.power\(x-mu_x,2.)/(2*np.power(sigma_x,2.))-np.power(y-mu_y,2.)/\(2*np.power(sigma_y,2.)))return(f_x_y)#在已经定义好的画布上加入高斯函数
x_values= np.linspace(-5,5,2000)
y_values= np.linspace(-5,5,2000)
X,Y= np.meshgrid(x_values,y_values)
mu_x,mu_y,sigma_x,sigma_y=0,0,0.8,0.8
F_x_y= gaussian_2(X,Y,mu_x,mu_y,sigma_x,sigma_y)#显示三维图
fig= plt.figure()
ax= plt.gca(projection='3d')
ax.plot_surface(X,Y,F_x_y,cmap='jet')# 显示等高线图#ax.contour3D(X,Y,F_x_y,50,cmap='jet')#plt.show()
举例3 颜色渐变画图
例子参考codeday的最后一个举例
import matplotlib.pyplotas pltimport numpyas np

x= np.linspace(0,1,10)
number=5
cmap= plt.get_cmap('gnuplot')
colors=[cmap(i)for iin np.linspace(0,1, number)]for i, colorinenumerate(colors, start=1):
    plt.plot(x, i* x+ i, color=color, label='$y = {i}x + {i}$'.format(i=i))
plt.legend(loc='best')
plt.show()如果是子图的形式展示,即ax.plot()的形式,那么里面的颜色表示为c=color因为ax里面是使用的c而不是全名color表示颜色变量