一、绘图
add_subplot方式
fig = plt.figure(figsize=(10,10)):表示初始化figure画布对象。
figsize表示图像大小,单位英寸inch,默认为defaults to rcParams[“figure.figsize”] = [6.4, 4.8].ax = fig.add_subplot(3,2,plt_index):表示添加的子图处在画布的位置
3行2列,此图在第plt_index个位置。
第一幅图的下标从1开始。
行数*列数要大于等于要创建子图的数量ax.imshow():图像的具体内容plt.show():显示画布
例子:
# 我要创建四张图import matplotlib.pyplotas plt# 设定整个画布的尺寸
fig= plt.figure(figsize=(10,10))# 第一幅图的下标从1开始,设置6张子图for plt_indexinrange(1,7):# 往画布上添加子图:按三行二列,添加到下标为plt_index的位置
    ax= fig.add_subplot(3,2,plt_index)# 绘制对应的子图
    ax.imshow(np.arange(0,100).reshape(10,10))pass# 显示画布
plt.show()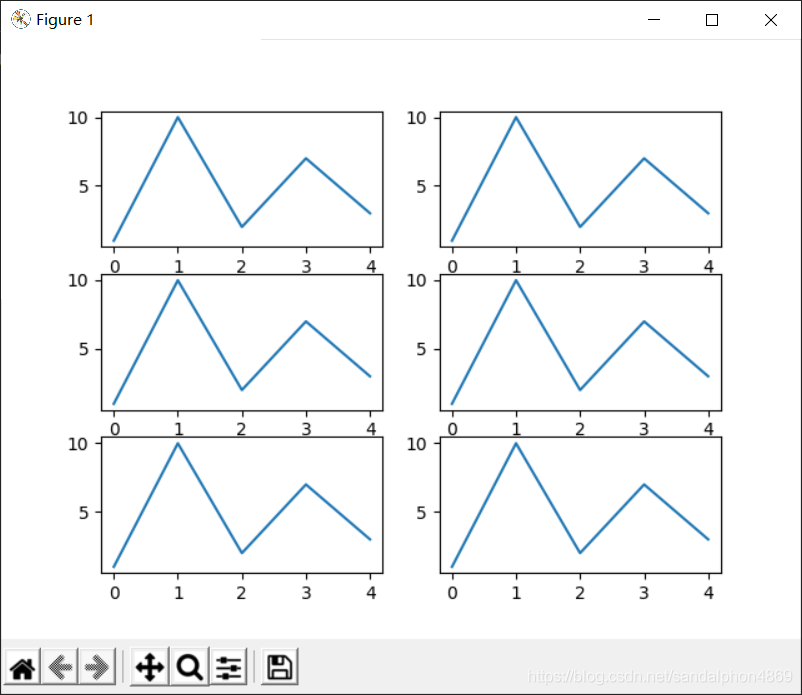
subplot方式
# 我要创建四张图import matplotlib.pyplotas plt# 设定整个画布的尺寸
plt.figure(figsize=(10,10))# 第一幅图的下标从1开始,设置6张子图for plt_indexinrange(1,7):# 往画布上添加子图:按三行二列,添加到下标为plt_index的位置
    plt.subplot(3,2, plt_index)# 绘图
    plt.plot([1,10,2,7,3])# 显示画布
plt.show()
二、设置
无缝布局
import matplotlib.pyplotas plt
plt.figure()for plt_indexinrange(1,7):
    plt.subplot(3,2, plt_index)
    plt.plot([1,10,2,7,3])

plt.subplots_adjust(wspace=0, hspace=0)
plt.show()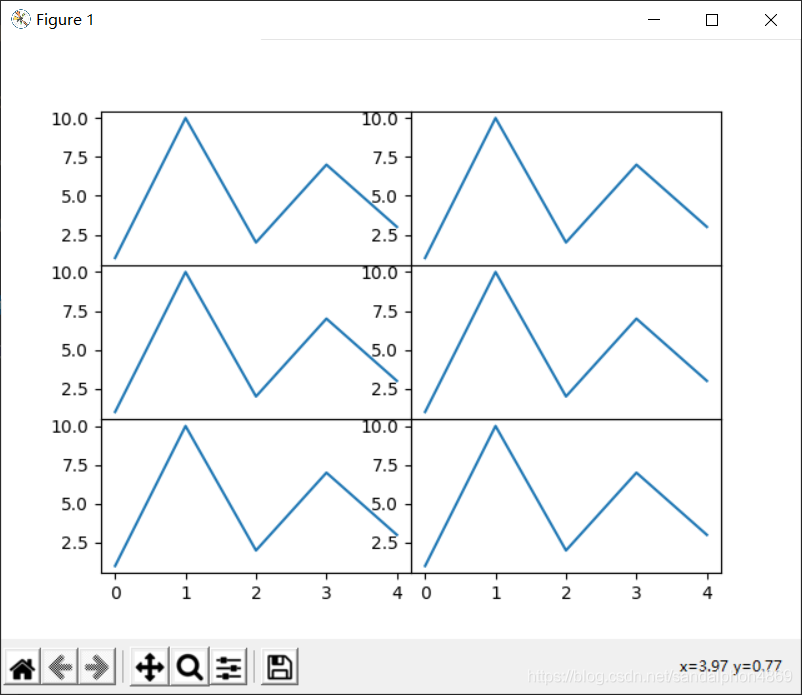
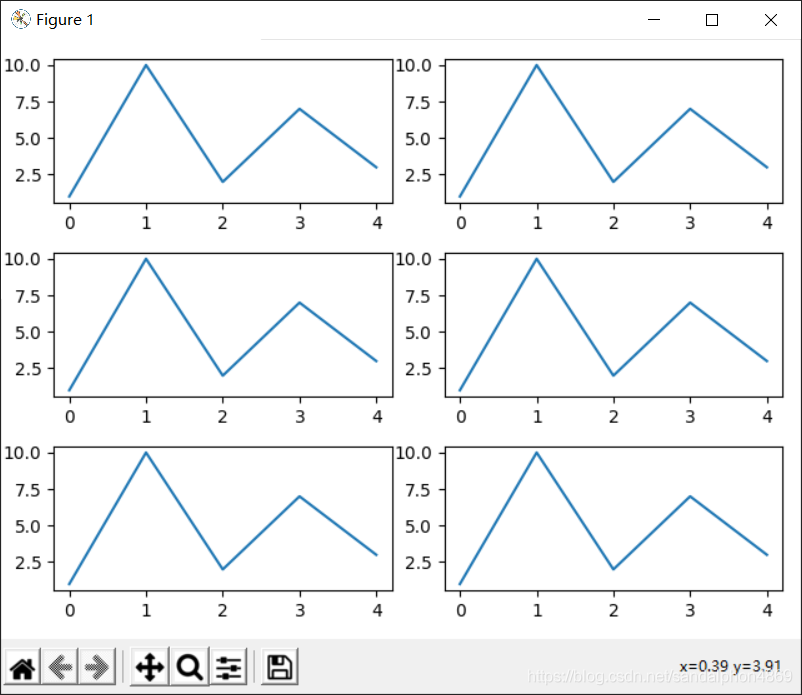
紧密布局
import matplotlib.pyplotas plt
plt.figure()for plt_indexinrange(1,7):
    plt.subplot(3,2, plt_index)
    plt.plot([1,10,2,7,3])

plt.tight_layout()
plt.show()