前言
最近在做一个微信小程序的项目,需要根据服务端返回的列表,动态生成echart,这里记录一下具体的使用过程。
步骤
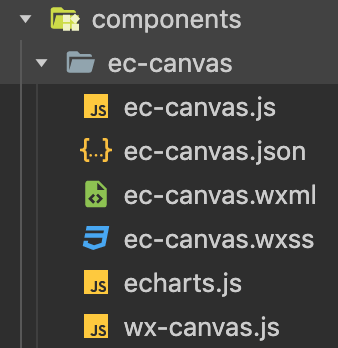
1、去github下载小程序版echart,解压后放在components目录下,目录结构如下:
2、在需要显示图表的页面对应的index.json文件中引入组件
{
  "navigationBarTitleText": "",
  "usingComponents": {
    "ec-canvas":"/components/ec-canvas/ec-canvas"
  }
}
3、index.wxml代码如下
<view class="water-monitor-item" wx:for="{{devices}}" wx:key="index">
    <view class="container" hidden="{{showDialog}}">
        <ec-canvas id="{{'mychart' + (index+1) }}" ec="{{ item.ec }}"></ec-canvas>
    </view>
</view>
4、index.js页面代码如下:
let app = getApp()
import * as echarts from "../../components/ec-canvas/echarts"

Page({
  data: {
    list: []
  },
  onLoad() {
    this.getList()
  },
  getList() {
    app
      .request({
        url: "xxxx",
        method: "GET"
      })
      .then((res) => {
        this.initData(res.rows)
      })
      .catch((err) => {})
  },
  initData(rows) {
    for (const index in rows) {
      let row = rows[index]
      row.ec = { lazyLoad: true }
    }
    this.setData({ list: list }, () => {
      this.initChart()
    })
  },
  initChart() {
    for (let i = 0; i < this.data.list.length; i++) {
      let data = this.data.list[i]
      let { xAxisLabels, series } = this.getChartData(data.chartData)
      let ecComponent = this.selectComponent("#mychart" + (i + 1))
      ecComponent.init((canvas, width, height, dpr) => {
        // 获取组件的 canvas、width、height 后的回调函数
        const chart = echarts.init(canvas, null, {
          width: width,
          height: height,
          devicePixelRatio: dpr // new
        })
        canvas.setChart(chart)
        setOption(chart, xAxisLabels, series)
        return chart
      })
    }
  },
  getChartData(chartData) {
    let xAxisLabels = []
    let series = [[], [], [], [], [], [], []]
    for (const i in chartData) {
      let tempData = chartData[i]
      let time = tempData.dateTime.substring(5)
      xAxisLabels.push(time)
      series[0].push(tempData.ry)
      series[1].push(tempData.sw)
      series[2].push(tempData.ph)
      series[3].push(tempData.yd)
      series[4].push(tempData.zd)
      series[5].push(tempData.water)
      series[6].push(tempData.dd)
    }
    return { xAxisLabels: xAxisLabels, series: series }
  }
})

function setOption(chart, xAxisLabels, seriesData) {
  var option = {
    tooltip: {
      trigger: "axis",
      axisPointer: {
        // 坐标轴指示器,坐标轴触发有效
        type: "shadow" // 默认为直线,可选为:'line' | 'shadow'
      },
      confine: true
    },
    legend: {
      show: true,
      data: ["指标1", "指标2", "指标3", "指标4", "指标5", "指标6", "指标7"]
    },
    grid: {
      left: 10,
      right: 10,
      bottom: 10,
      top: 60,
      containLabel: true
    },
    dataZoom: {
      type: "slider",
      start: 0,
      end: 100
    },
    yAxis: [
      {
        type: "value",
        axisLine: {
          lineStyle: {
            color: "#666"
          }
        },
        axisLabel: {
          color: "#333"
        }
      }
    ],
    xAxis: [
      {
        type: "category",
        axisTick: { show: false },
        data: xAxisLabels,
        axisLine: {
          lineStyle: {
            color: "#666"
          }
        },
        axisLabel: {
          color: "#333",
          formatter:function(value){
            return value.replace(" ", '\n');
          }
        }
      }
    ],
    series: [
      {
        name: "指标1",
        type: "line",
        data: seriesData[0]
      },
      {
        name: "指标2",
        type: "line",
        data: seriesData[1]
      },
      {
        name: "指标3",
        type: "line",
        data: seriesData[2]
      },
      {
        name: "指标4",
        type: "line",
        data: seriesData[3]
      },
      {
        name: "指标5",
        type: "line",
        data: seriesData[4]
      },
      {
        name: "指标6",
        type: "line",
        data: seriesData[5]
      },
      {
        name: "指标7",
        type: "line",
        data: seriesData[6]
      }
    ]
  }
  chart.setOption(option)
}
问题总结:
1、echart体积太大,可以在官网选择对应的版本在线定制
2、x轴数据太多,展示不下,echart添加缩放功能
dataZoom: {
    type: "slider",
    start: 0,
    end: 100
}
3、真机上,canvas层级过高,遮住弹窗组件,在对应的父组件上添加hidden,显示弹窗时,隐藏父组件即可
<view class="container" hidden="{{showDialog}}">
    <ec-canvas id="{{'mychart' + (index+1) }}"   ec="{{ item.ec }}"></ec-canvas>
</view>
4、关闭弹窗后,发现滚动条自动回到了初始位置,体验不是很好,这是因为隐藏父组件后,整个页面的高度变小了,滚动条消失了,关闭弹窗后,重新显示父组件,页面恢复到原来得高度,滚动条也到了初始位置,可以加一个相同样式的占位的组件
<view class="container" hidden="{{showDialog}}">
<ec-canvas id="{{'mychart' + (index+1) }}" ec="{{ item.ec }}"></ec-canvas>
</view>
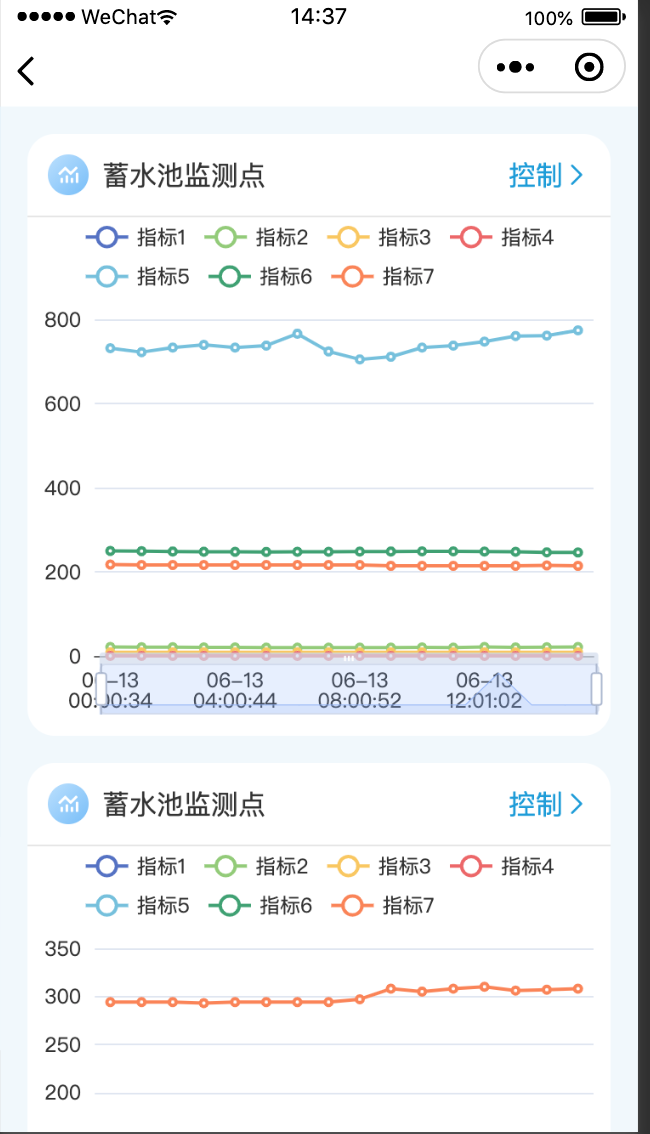
<view class="container" hidden="{{!showDialog}}"></view>效果图